Processing IDE
(Integrated Development Environment)
Processing IDE is the coding software I have used for this exercise.
Task 1:
First I have tried to explore with simple shapes such as triangles and parallelogram to form a shape.
Here I have typed in codes to create two triangles and parallelogram to form a folded paper.
size(480, 120);
quad(158, 55, 199, 14, 392, 66, 351, 107);
triangle(347, 54, 392, 9, 392, 66);
triangle(158, 55, 290, 91, 290, 112);
Here I have created a rectangle, then I have played around with the code.
I have made more rectangles and each one gets smaller.
The first rectangle:
size(480, 120);
rect(180, 10, 220, 40);
then add
rect(180, 60, 220, 20);
rect(180, 60, 220, 10);
Exercise
- Drawing in Processing
Shapes: point, line, rectangle, ellipse etc.
Colour: RGB
- Simple data visualisation in Processing
Check the example code
Play with code to change shape colour, position
To draw a line between coordinate (20, 50) and (420, 110)
size(480, 120);
line(20, 50, 420, 110);
I have drawn 3 different sizes of circles attaching to each other. This example, the y coordinate for the first ellipse is outside the window.
size(480, 120);
ellipse(278, -100, 400, 400);
ellipse(120, 100, 110, 110);
ellipse(412, 60, 18, 18);
Here I have experimented with grey scale colours. This example shows three different tone on a black background.
size(480, 120);
background(0);
fill(204);
ellipse(132, 82, 200, 200);
fill(153); // Medium gray
ellipse(228, -16, 200, 200);
fill(102); // Dark gray
ellipse(268, 118, 200, 200);
Here I combined the use of grey scale colour and stroke. No outline is "noStroke()", disable fill of shape is "noFill()"
size(480, 120);
fill(153);
ellipse(132, 82, 200, 200);
noFill();
ellipse(228, -16, 200, 200);
noStroke();
ellipse(268, 118, 200, 200);
Here I have applied the RGB colours to the circles.
The three numbers stand for the values of red, green, and blue, and they range from 0 to 255
size(480, 120);
noStroke();
background(0, 26, 51);
fill(255, 0, 0);
ellipse(132, 82, 200, 200);
fill(0, 255, 0);
ellipse(228, -16, 200, 200);
fill(0, 0, 255);
ellipse(268, 118, 200, 200);
Data Visualisation
Here is an example research of data visualisation created by codes on Processing.
I will use this as a research for my own design.

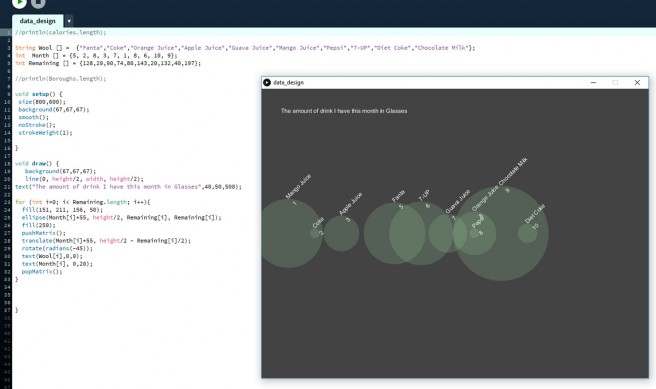
This is my own data visualisation design created on processing.
I have first collected my own data. (Amount of drink I've had in a month in glasses) With this data, I have replaced the value from the research with my data.
I have also changed the colours to make it more aesthetic pleasing.
String Drink [] = {"Fanta","Coke","Orange Juice","Apple Juice","Guava Juice","Mango Juice","Pepsi","7-UP","Diet Coke","Chocolate Milk"};
int Glasses [] = {5, 2, 8, 3, 7, 1, 8, 6, 10, 9};
int ML [] = {128,20,90,74,80,143,20,132,40,197};
void setup() {
size(800,600);
background(67,67,67);
smooth();
noStroke();
strokeWeight(1);
}
void draw() {
background(67,67,67);
line(0, height/2, width, height/2);
text("The amount of drink I have this month in Glasses",40,50,500);
for (int i=0; i< ML.length; i++){
fill(151, 211, 156, 50);
ellipse(Glasses[i]*55, height/2, ML[i], ML[i]);
fill(250);
pushMatrix();
translate(Glasses[i]*55, height/2 - ML[i]/2);
rotate(radians(-45));
text(Drink[i],0,0);
text(Glasses[i], 0,20);
popMatrix();
}
}

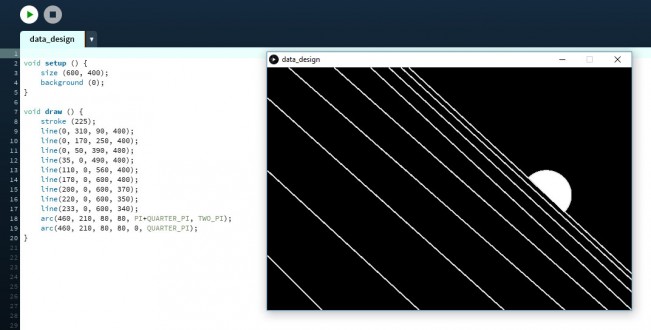
For the homework, I have followed the tutorial from the first example and created a simple drawing using the following code:
void setup () {
size (600, 400);
background (0);
}
void draw () {
stroke (225);
line(0, 310, 90, 400);
line(0, 170, 250, 400);
line(0, 50, 390, 400);
line(35, 0, 490, 400);
line(110, 0, 560, 400);
line(170, 0, 600, 400);
line(200, 0, 600, 370);
line(220, 0, 600, 350);
line(233, 0, 600, 340);
arc(460, 210, 80, 80, PI+QUARTER_PI, TWO_PI);
arc(460, 210, 80, 80, 0, QUARTER_PI);
}
Homework
I have followed another tutorial from the homework example and created a simple drawing of squares using the following code:
size(500,400);
fill(0,127,255);
rect(20,20,10,10);
smooth();
rotate(radians(10));
pushMatrix();
scale(2.0);
rect(20,20,10,10);
pushMatrix();
scale(2.0);
rect(20,20,10,10);
pushMatrix();
scale(2.0);
rect(20,20,10,10);
pushMatrix();
scale(2.0);
rect(20,20,10,10);
popMatrix();